
This is an extract from a recent report “European Electricity Review 2024” by EMBER. In this extract we focus on EU electricity and source-wise trends.
Electricity Generation
Current status
In 2023, the EU electricity mix reached a new milestone with more than two-thirds of electricity coming from clean sources for the first time. Wind and solar combined to produce 27% (721 TWh) of total EU electricity generation – more than nuclear at 23% (619 TWh) and hydro at 12% (317 TWh). Bioenergy and other renewables contributed a further 5.9% (159 TWh). The share of fossil generation fell to its lowest ever – just a third (33%) of total generation, down six percentage points from 39% in 2022. Gas remained the largest source of fossil generation at 17% in 2023 (452 TWh), while coal generation only made up 12% (333 TWh). The rest came from other fossil generation, such as oil, at 3.5% (95 TWh).
Long-term trend
The EU’s reliance on fossil fuels for electricity has declined substantially since 2000, when over half (52%) of EU electricity came from coal, gas and other fossil sources. This fell to just 33% in 2023. Much of this fall happened since 2009 as wind and solar began to increase. Wind and solar generation grew fivefold from 2009 to 2023, from just 139 TWh to 721 TWh. Their combined share in the EU’s power mix rose from 5% to more than a quarter (27%) in the same period. This rapid growth happened as some EU countries, like Germany, became early adopters of wind and solar power at a large scale in the early 2010s. Generation from other clean sources has moderately declined over the last two decades. Nuclear generation fell by 22%, from 860 TWh in 2000 to 619 TWh in 2023. Hydro generation declined 21%. The share of the two sources fell from 33% to 23% for nuclear and 13% to 12% for hydro generation, following lows in 2022 amidst maintenance, heat waves and droughts.
Electricity Demand
Current status
EU electricity demand fell 3.4% year-on-year. In 2023, EU electricity demand was 2,697 TWh, a fall of 94 TWh (-3.4%) compared to 2,790 TWh in 2022. In 2023, the EU was responsible for 9% of global electricity demand. The EU’s four largest economies made up more than half (58%) of EU electricity demand. Germany accounted for 19% (515 TWh), France 17% (464 TWh), Italy 12% (315 TWh) and Spain 9.5% (256 TWh).
Across Europe, per capita demand was 6.1 MWh in 2023. Finland (14.7 MWh) and Sweden (13.2 MWh) have the highest electricity demand per capita among the ten countries with the highest electricity demand. Their demand per capita is more than twice the EU average. This is caused by higher energy demand due to their colder climates and high economic development as well as higher electrification rates, with greater adoption of electric vehicles and heat pumps than in other EU countries. Spain (5.4 MWh), Italy (5.3 MWh) and Poland (3.5 MWh) have lower than average electricity demand per capita. As the power supply becomes cleaner, electrification will be the key lever in decarbonisation across industries.
Long-term trend
After rising throughout the 2010s, EU demand peaked at 1,036 TWh in 2008. It has since remained largely stable with only small declines. In 2023, demand was 6% lower than the peak, at 974 TWh. Germany showed one of the largest declines since 2008, falling 16% (-97 TWh). Its share of EU demand dropped by 1.5 percentage points, from 20.6% in 2008 to 19.1% in 2023. Over the same period, Poland’s electricity demand increased by 12% (+11 TWh) and made up 6.4% of EU electricity demand in 2023, up from 5.2% in 2008.
Over the last two decades, wind and solar additions displaced fossil generation and compensated for falls in other clean generation. This further accelerated the reduction of fossil generation in years where demand fell. In 2023, demand falls of 94 TWh, combined with wind and solar growth of 90 TWh and growth in other clean sources of 37 TWh, led to a fall in fossil generation of 209 TWh. In order for emissions to continue to fall, clean electricity growth needs to meet and exceed new electricity demand. In the EU, four out of the last five years saw demand fall, contributing to a reduced need for fossil generation.
Power Sector CO2 Emissions
Current status
In 2023, EU countries emitted 653 million tonnes of CO2 from electricity generation. This was a stark 19% drop in emissions (-157 MtCO2) compared to 2022 (811 MtCO2). Combined, EU countries contributed 4.6% of global power sector emissions in 2023. Power sector emissions in the EU are dominated by the bloc’s largest fossil generating countries. Germany (29%, 188 MtCO2), Poland (17%, 112 MtCO2) and Italy (13%, 87 MtCO2) made up 59% of emissions despite only representing 37% of EU electricity demand. France was the exception among the EU’s large economies, representing just 4.4% (29 MtCO2) of EU power sector emissions in 2023, despite being responsible for 17% of electricity demand. This is due to its low share of fossil generation in the mix. However, 22 countries – each representing only 5% or less of total EU emissions – still combined to make up nearly a third (32%) of EU power sector emissions. This highlights the need for shared responsibility in emissions reductions in the power sector.
In 2023, emissions intensity across the entire EU was 242 gCO2/kWh, down 17% from 292 gCO2/kWh in 2022. The three largest coal power countries had the highest carbon intensity for electricity generation in 2023: Poland (662 gCO2/kWh), Czechia (450 gCO2/kWh) and Germany (371gCO2/kWh). All still have a high share of coal in their mix (Poland 61%, Czechia 40%, Germany 26%), significantly above the EU average (12%). Czechia’s emissions per capita (3.3 tonnes of CO2) were more than twice the EU average of 1.5 tCO2 in 2023. Likewise, Poland (2.9 tCO2) and Germany (2.2 tCO2) were significantly above average. Belgium (1 tCO2), Sweden (0.7 tCO2) and France (0.4 tCO2) had some of the lowest emissions per capita in 2023 due to their low share of fossil and high share of low carbon sources like nuclear, hydro, wind and solar.
Long-term trend
Power sector emissions in the EU have nearly halved since their peak in 2007 – falling by 46% from 1,218 MtCO2 to 653 MtCO2 in 2023. This equates to an average annual decline of 3.8%. The fall has accelerated in recent years, with emissions declining at a rate of 5.2% annually in the period since 2015.
The decline in emissions is driven by an increase in generation from wind and solar and the subsequent reduced dependence on fossil fuels. Electricity demand in the EU has also fallen 9.3% since its peak in 2008, contributing further. The large reduction in EU emissions intensity reflects these trends. One kilowatt hour of electricity produced in 2003 resulted in 424 grams of CO2 emitted. In 2023 this was just 242 grams of CO2, a reduction of 43%.
While emissions decline in the EU had accelerated to an average of 5.2% annually since the Paris Agreement, 2023 represented a significant step change with emissions falling more than three times as fast. While total EU emissions have been falling since 2007, some countries have achieved faster declines than others, driven largely by the adoption of wind and solar. Among the largest EU emitters, Spain’s emissions declined fastest. Its 2023 emissions of 47 MtCO2 were 55% lower than those in 2000 (104 MtCO2).
Analysis of the different electricity sources in 2023
Solar
Solar power produced a record 9.1% (246 TWh) of EU electricity in 2023. Solar provides clean power that can be deployed quickly and locally to the demand source. As such, it will form the backbone of the future electricity system and together with wind provide nearly 70% of global electricity by 2050.

Germany was the largest solar power producer in the EU in 2023. The Mediterranean countries of Spain (45 TWh), Italy (31 TWh) and France (23 TWh) are the second, third and fourth largest solar producers. In 2023, Greece had the highest share of solar power in its electricity mix with 19%, followed by Hungary at 18% and Spain at 17%, far above the EU average of 9.1%. At 1,086 kWh, the Netherlands had the highest solar generation per capita in 2023. This was more than double the EU average of 553 kWh per capita.
EU solar generation reached a new all-time high of 246 TWh, up 36 TWh compared to 2022 (211 TWh). Despite record solar capacity additions, the year-on-year generation increase of 36 TWh (+17%) was only the second largest after the increase of 48 TWh (+29%) in 2022. With increased capacity installed, the rise in generation could have been even higher. Every month in 2023 set a new seasonal record for solar generation in the EU. May, June and July set three consecutive all-time monthly records for solar generation in the EU. In May, solar generated 28 TWh, followed by 31 TWh in June and July respectively. These beat the previous record monthly high of 27 TWh set in July 2022.
Wind
Wind power produced 18% (475 TWh) of EU electricity in 2023, for the first time surpassing gas generation (17%, 452 TWh). Wind, alongside solar, is key to reducing emissions in the electricity sector. Both sources will form the backbone of the future electricity system by providing nearly 70% of global electricity by 2050. Therefore, rapid scale-up is required this decade.
Germany led the EU in wind generation with 141 TWh, followed by Spain (64 TWh), France (49 TWh) and Sweden (35 TWh). Denmark produced 58% of its electricity from wind, far more than any other EU country. Ireland (36%) and Portugal (29%) had the second and third highest shares. Nordic countries produced the most wind power per capita. In 2023, Sweden generated 3,248 kWh per capita, slightly ahead of Denmark (3,246 kWh per capita) and Finland in third (2,529 kWh per capita).
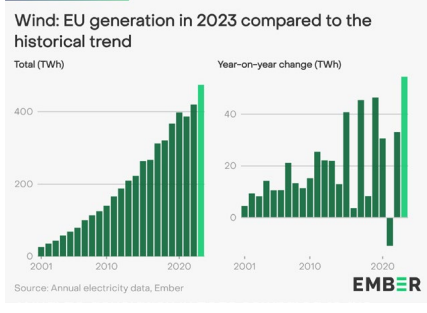
EU wind generation reached a new record high of 475 TWh in 2023, up from 420 TWh in 2022. Wind generation increased by 55 TWh (+13%) in 2023, the largest absolute increase on record. This surpassed the previous highest generation increase of 47 TWh in 2019. 2023 saw record new wind installations of 17 GW, despite wind capacity additions slowing in recent years.
Coal
Coal power produced 12% (333 TWh) of EU electricity in 2023. Coal is the single largest contributor to emissions from the power sector. As per the IEA’s Net Zero scenario, unabated coal plants must be phased out by 2030 in the EU. The story of coal in the EU is one of decline. It continues to be undercut by new wind and solar. Except for Poland and Bulgaria, all EU countries have pledged to exit coal generation by 2033 at the latest. Germany’s official exit date is still in 2038, but its government has signalled its intent to bring this forward as only a handful of lignite power plants are scheduled to remain open after 2030. As such, coal’s role in the EU’s electricity system will continue to diminish.

EU coal generation reached a new all-time low of 333 TWh in 2023, down by 116 TWh from 2022 (449 TWh), and 19 TWh below the previous all-time low set in 2020 (352 TWh). The overall fall in coal generation of 116 TWh (-26%) was the highest year-on-year percentage reduction of all time. It was also the second largest absolute fall behind 2019 which saw a fall in generation of 145 TWh.
Coal generation dropped across Europe in 2023. The biggest falls came in Germany (-48 TWh) and Poland (-22 TWh), with Bulgaria (-10 TWh) and Italy (-8.7 TWh) also showing significant decreases. Germany’s decrease in coal generation accounted for more than 40% of the EU’s total fall. The EU has recorded five year coal lows every month since May 2023, with generation particularly low in November and December compared to previous years.
Hydro
Hydro power produced 12% (317 TWh) of EU electricity in 2023. Mediterranean countries, such as Spain, France and Italy are already feeling the effects of climate change and the increased probability of droughts. Sweden was the EU’s largest hydro power producer in 2023, producing 66 TWh, ahead of France (53 TWh) and Austria (40 TWh). Austria recorded the highest share of hydro generation with 59%, followed by Croatia (46%) and Sweden (40%). Sweden also had the highest hydro generation per capita at 6,305 kWh, significantly more than Austria (4,371 kWh) and Finland (2,529 kWh) which ranked second and third.

EU hydro generation recovered from a recent low in 2022 to reach 317 TWh. This represented an increase of 41 TWh (+15%). Amid heat waves and droughts, hydro generation had fallen significantly in 2022. While 2023 represents a recovery, it was still the year with the third lowest hydro generation in the last decade, despite capacity additions over that time period.
The largest hydro generation increases were recorded in Italy which saw an increase of 9.9 TWh (+35%). This marked a recovery from being hit hard by droughts in 2022. Similarly, France (+7.7 TWh, +17%) and Austria (+5 TWh, +14%) saw generation rebound from 2022 lows. The last few years have shown stronger variability in hydro output from year to year caused by droughts. However, there is no clear trend of hydro generation showing structural decline.
Bioenergy
Bioenergy produced 5.7% (153 TWh) of EU electricity in 2023. Bioenergy has been widely assumed to be carbon neutral. However, recent scientific evidence is clear that there is a major risk of significant carbon emissions from many forms of biomass, particularly woody biomass. Given these risks, countries should aim to minimise or eliminate the inclusion of large-scale bioenergy in the power sector.
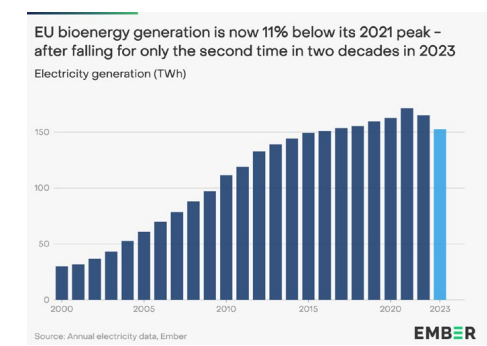
Germany produced the most electricity from bioenergy in the EU in 2023 with 47 TWh, representing nearly a third of total EU generation from bioenergy. Italy (16 TWh) and Sweden (12 TWh) are the second and third largest producers. The main bioenergy fuel in Germany and Italy is predominantly biogas, but in many other countries it is biomass. Denmark (21%), Finland (13%) and Germany (9%) had the highest shares of bioenergy in their energy mix in 2023. At 1,806 kWh, Finland had the highest generation per capita, ahead of Sweden (1,051 kWh) and Denmark (1,025 kWh).
Total bioenergy generation in the EU fell for the second year in a row to 153 TWh in 2023. The fall of 13 TWh (-7.6%) in 2023 was only the second fall in the last two decades, after 2022 also saw generation decline. The decline comes amid stricter EU rules on biomass use and new biomass installations. Since 2000, generation from bioenergy has risen substantially in the EU. In 2000, generation was at just 30 TWh. In 2021, this reached 172 TWh. In 2022 and 2023, the EU saw the first falls in bioenergy. Mirroring its trajectory in total generation, the share of bioenergy in the EU’s electricity mix has grown over the last two decades. While bioenergy only made up 1.1% of the mix in 2000, this had risen to 4.8% by 2013 and has stayed around 5% for the last decade, reaching 5.7% in 2023.
Access the complete report here


