
Extracted from IEEFA’s report, “Solar Surge Set to Drive Much of Remaining Texas Coal-Fired Fleet Offline”
Coal-fired power generation in Texas, pummelled by clean, no-fuel-cost wind over the past 10 years, is about to be hit by a second wave of competition from renewables as utility-scale solar power, which is still only a small component of the state’s generation mix, stands to gain significant market share over the next few years. While installed solar power capacity in the US has grown by almost 4,000% over the past 10 years, its growth rate in Texas—specifically across the vast footprint of the Electric Reliability Council of Texas (ERCOT), has been even faster. This latest report by IEEFA highlights how the growth in utility-scale PV production is rapidly changing the ERCOT market.
Wind power has set the stage for solar in Texas
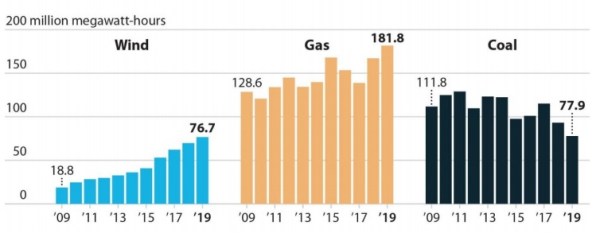
The impact from the rise in solar generation would not be nearly as dramatic without developments over the past decade that have set the stage for more renewables. In 2009, coal-fired power plants generated 111.8 million MWh of electricity, accounting for 36.6% of ERCOT demand. By 2019, coal’s output had dropped to 77.9 million MWh and its market share had fallen to 20.3%—even though electricity demand in ERCOT rose significantly over the same period of time (from 305.4 million MWh in 2009 to 384 million MWh by 2019, a 25.7% increase).
The reasons for the sharp decline in coal generation are straightforward: Developers built a significant amount of no-fuel-cost wind power. In addition, gas prices, driven by the surge in fracking, have remained consistently low. Installed wind capacity in ERCOT grew by almost 15,000 MW over 10 years, pushing the total at the end of 2019 to 23,860 MW. This growth raised total wind generation from 18.8 million MWh to 76.7 million MWh, boosting wind’s share of the ERCOT power generation market from 6.2% to 19.97% and putting it nearly on par with the state’s coal generators. Gas-fired generation also grew substantially over the same 10 years, from 128.6 million MWh in 2009 to 181.8 million MWh at the end of 2019 (these numbers include gas combined-cycle units and other gas generators), as the market share of gas-fired generation went from 42.1% in 2009 to 47.3% in 2019.
Source: US Energy Information Administration
Put another way, wind and gas generation have supplied all the electricity demand growth in ERCOT while taking a significant bite out of coal-fired generation. This shift picked up speed in the first six months of 2020, with coal’s share of the market shrinking to 16.4% while wind has climbed to 25.4%. And, as with the earlier market shifts, these changes are occurring even as the overall ERCOT market continues to grow.
Looking ahead, significant new wind capacity additions are in the pipeline. ERCOT estimates a total of 35,000 MW of wind generation could be online by the end of 2021, an almost 50% increase from current levels. Into this mix comes a surge of solar.
Solar surge
The solar surge is evident in two separate statistics—one showing the wave of new generation capacity expected to come online in the next two years and the other charting current solar generation. At the end of 2019, 2,281 MW of utility-scale solar capacity existed in ERCOT. This marked a 15,102% increase over 2010, when ERCOT had only 15 MW of solar generation.
By the end of May 2020, an additional 420 MW had been added to the generation stack and another 1,057 MW of solar had been synchronized with the grid in preparation for full deployment, effectively bringing ERCOT’s total installed solar capacity to 3,748 MW. An additional 2,053 MW are in the queue and likely to be completed late this year or in early 2021, having secured interconnection agreements and project-specific financing needed for the transmission service provider (TSP) to complete any needed upgrades to bring the capacity online. While these 2,053 MW are not certain to come online, an ERCOT official tells IEEFA that once projects reach this stage they have a strong likelihood of entering commercial operation, although there may be some slippage from one year to the next, especially for projects with a projected online date late in any given year.
For the sake of clarity, IEEFA has assumed in this analysis that all of this new capacity will come online as scheduled, which would push ERCOT’s solar capacity to 5,801 MW by end-2020 and, with another 5,326 MW of advanced-stage projects expected online next year, to 11,127 MW by end-2021. The graphic below includes ERCOT projects that have signed a grid interconnection agreement with a TSP, but which have not yet funded the needed system upgrades to get the project’s output onto the grid. IEEFA believes it is realistic to assume in this analysis that 50% of these projects will enter commercial service. This would add another 1,272 MW of solar capacity to the ERCOT grid by end-2021—bringing the system’s solar total to 12,399 MW.
Projects with an additional 1,175 MW of capacity that are scheduled to begin commercial operation in 2022 already have posted the financing needed to pay for their needed transmission system upgrades, but they are not included in the current analysis. However, they are a clear indication that solar growth in ERCOT will continue in the years ahead, further stressing the system’s already threatened coal plants.

Source: ERCOT
The generation trends are highlighted in the graphic below from EIA’s hourly data browser showing market share by generation source on May 4, a date that marked the first time daily solar generation in ERCOT topped 30,000 MWh and just the second time solar accounted for 3% of the system’s daily electricity demand. Just five days later, solar set another record, meeting more than 4% of total ERCOT demand on May 9. It is worth noting here that ERCOT did not separately track solar until 2016 and that it only just climbed above 1% of annual ERCOT demand in 2019. Now, solar is well on its way to topping 2%; through June of this year, solar had produced just under 2.1% of ERCOT’s electricity.

Source: US Energy Information Administration
The impact on coal-fired generation
Given coal’s position in ERCOT’s generation dispatch curve—that is, dispatched after wind, solar, nuclear and, for the past decade, gas—solar poses a significant threat to the state’s remaining coal-fired power plants. Solar clearly is already beginning to have an impact on the ERCOT market. During the week of May 28-June 3, solar plants in ERCOT sent 218,540 MWh into the grid, accounting for just over 3% of the week’s total generation, which was 7,279,545 MWh. But just looking at the daytime figures pushes solar’s share of the market up to 4.4%—market share that we believe would otherwise have been supplied by coal.
For the year through June, solar has generated 3.7 million MWh of electricity, an average of slightly more than 624,000 MWh a month. Using that average for the remainder of the year would push total solar generation to almost 7.5 million MWh—or just under 10% of coal’s total generation in 2019. And that solar figure is almost certainly understated because of a significant jump in monthly solar generation from April to June reflecting the integration of 410 MW of new solar capacity onto the ERCOT grid during the month. This means solar’s average monthly generation for the whole year could end up being even higher than the current 624,000 MWh through June, taking more market share from coal. This year’s changes, impressive though they are, are barely a ripple compared to the wave of solar generation that will reshape ERCOT’s competitive marketplace as early as 2022.
Battery storage will add to solar’s momentum
While the growing daytime effects of solar power generation are increasingly visible, solar will become an increasingly round-the-clock force as developers and utility companies invest in a once-peripheral and now mainstream area of the electricity industry: Battery-storage technology, which has become de rigueur for many new utility-scale solar projects in states surrounding Texas and is being retrofit on a growing number of existing PV facilities.
“While the growing daytime effects of solar power generation are increasingly visible, solar will become an increasingly round-the-clock force as developers and utility companies invest in a once-peripheral and now mainstream area of the electricity industry.”
In Oklahoma, for example, NextEra last year signed a contract with Western Farmers Electric Cooperative to develop a 700 MW wind-solar-battery project that will include 200 MW of storage. It will be the biggest project of its kind in the US. In Arkansas, Entergy Arkansas gained approval in April for a solar-storage project that combines 100 MW of generation with 10 MW of storage. In New Mexico, Public Service Company of New Mexico is replacing its 560 MW stake in the soon-to-be-retired 874 MW San Juan Generating Station with a larger and more modernized mix of new generation sources that regulatory staff are advising include 650 MW of solar and 300 MW of battery storage. In addition, the state’s first tribally owned utility-scale solar project, developed on Jicarilla Apache land, pairs a 50 MW panel array with a 20 MW storage component. In Nevada, the Gemini Solar Project, which will be the biggest solar farm in the country, will include a 380 MW solar-powered battery system tied to a 690 MW array of collector panels. Also in Nevada, NV Energy is building 1,200 MW of solar generation paired with 590 MW of storage.
Texas utilities and project developers are only beginning to step into this market. In December, El Paso Electric published a resource development plan that includes 320 MW of storage by 2023. In June, a company called Broad Reach Power that has 3,000 MW of solar and storage projects in five states said it would install 150 MW of utility-scale storage this year across 15 sites in Texas. ERCOT itself has a battery energy storage initiative supervised by a task force whose mission is to advocate for electricity-storage development.
Projections for 2022
IEEFA’s analysis is based on 11,127 MW of installed solar capacity by end-2021. The impact this new capacity will likely have on the ERCOT grid has been illustrated in the following graphic.

Source: US Energy Information Administration
At least 70% of coal’s market share is at risk
IEEFA’s analysis of the January data shows 25 days when solar generation could knock more than 40% of any given day’s coal output offline. Of those 25 days, seven show solar potentially replacing all of coal’s daytime generation. In a somewhat surprising discovery, only one day in January had solar pushing anything less than 10% of coal’s output offline. Overall, the January analysis shows at least 70% of coal’s daytime output rendered potentially unnecessary in the long term, which would be a crippling blow for the ERCOT’s remaining coal generators. The week’s worth of May-June data—while smaller than the January sample— shows a similar trend. By 2022, solar generation will likely put more than 50% of daytime coal-fired output in jeopardy. Also worth noting: Zero-fuel-cost solar is likely to have a significant dampening impact on overall ERCOT prices during higher-demand warm weather periods.
These samples from January and the May-June week suggest a two-pronged threat to coal: First, by pushing a significant portion of coal’s output off the grid entirely and second, by lowering realized prices for the remaining generation.
The full report by IEEFA can be accessed by clicking here


